Read your results the way you would, only faster.
Gelly sizes, gates and counts, shows how it got there, and saves the result to the run it belongs to.
Analyze a gel right here.
The dashed ones are not built yet. They all end in the same thing — an amount, with an honest error bar on it. Open one and say you want it; that is how we pick the order.
An example colony PCR, insert expected at 1.2 kb. Gelly sizes every band against the ladder and tells you which colonies carry the insert.
| Lane | Bands (bp) | Call |
|---|---|---|
| Press “Size bands”. | ||
In development Band quantification: how much DNA is in each band, relative to the strongest. Saturated bands get flagged.
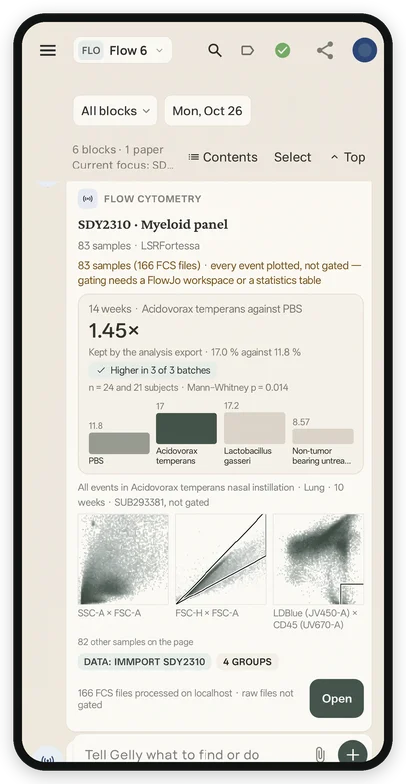
Drop FCS files, or the FlowJo workspace with them. Gelly reads your gates. Without a workspace it suggests the pre-gating, then compares groups with one number per sample.
Live cells · CD45 vs SSC-A · the CD45+ gate is drawn as an ellipse where straight cuts would clip it
Compare groups % CD45+ of live · one dot per well
Answer written for the notebook
Stimulated wells have more CD45+ live cells than unstimulated: median 39% vs 20.5%. Unstimulated n = 8 wells; stimulated n = 7, one well excluded with under 2,000 live events. The positive control is in range.
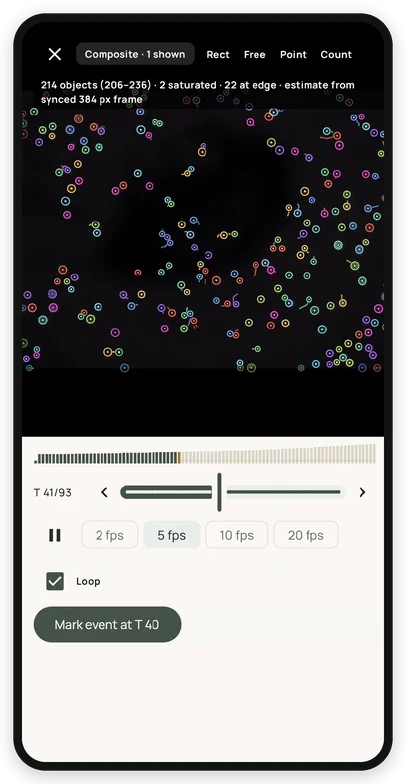
Open a time-lapse or Z-stack. Gelly counts spots at the scale you pick, tracks them across frames with gap closing, and flags a split as a division only when it looks like a mitosis.
Count LoG, 7× noise
Events on the timeline
The same gel reading, for protein. Gelly sizes the bands in kDa against a protein ladder, and with a dilution series of known amounts in lanes on the same gel it turns band darkness into micrograms.
What comes back into the notebook
- Size in kDa, read off your ladder
- Amount per band, from standards on that same gel
- Saturated lanes refused rather than guessed
How well done properly
±20–50%, and only within one gel
Every method here is written down with the method that produced it, so a gel band and a mass spectrometer never render as the same kind of number.
Not built Would you use this? Saying so is the only thing that moves it up the list.
Bradford, BCA, a NEFA kit, an OD series: a plate of readings and a few wells of known concentration. Gelly fits the curve, marks the wells that fall outside its linear range, and reads the rest off it.
What comes back into the notebook
- A concentration per well, carrying the fit’s own error
- Wells off the end of the curve marked, never extrapolated
- The plate map kept together with the numbers
How well done properly
±5–15%, with the curve on the same plate
Every method here is written down with the method that produced it, so a gel band and a mass spectrometer never render as the same kind of number.
Not built Would you use this? Saying so is the only thing that moves it up the list.
Hand Gelly the peak table, or the open .cdf the instrument writes next to its own format. It matches peaks to compounds, divides by the internal standard you spiked in, and gives a concentration per sample.
What comes back into the notebook
- mg/L per compound, against your internal standard
- A response factor kept per compound, not assumed to be 1
- Anything under the limit of quantitation shown as a limit, not a number
How well done properly
±2–10% with an internal standard
Every method here is written down with the method that produced it, so a gel band and a mass spectrometer never render as the same kind of number.
Not built Would you use this? Saying so is the only thing that moves it up the list.
Targeted transitions for the compounds you actually care about, with a labelled internal standard where you have one. The same arithmetic as GC, a different separation in front of it.
What comes back into the notebook
- A concentration per transition, per sample
- Labelled standards treated as the reference, not as another peak
- Untargeted feature tables left in the file they arrived in
How well done properly
±2–5% with a labelled standard
Every method here is written down with the method that produced it, so a gel band and a mass spectrometer never render as the same kind of number.
Not built Would you use this? Saying so is the only thing that moves it up the list.
Cq values and the plate layout. Gelly takes the efficiency from your own dilution series rather than assuming it doubles, then gives relative expression or absolute copies, and names the reference genes it used.
What comes back into the notebook
- A fold change with its confidence interval
- Efficiency per primer pair, from your curve
- No-template wells checked before anything is reported
How well done properly
±10–25% on a fold change
Every method here is written down with the method that produced it, so a gel band and a mass spectrometer never render as the same kind of number.
Not built Would you use this? Saying so is the only thing that moves it up the list.
The bioreactor’s log beside the samples you took by hand. Gelly lines the two clocks up, so a titer at 48 h sits next to the feed rate and the dissolved oxygen that produced it.
What comes back into the notebook
- Titer, yield and rate across the run
- Offline samples on the same clock as the probes
- The feed and induction history kept with them
How well done properly
only ever as good as the offline method behind it
Every method here is written down with the method that produced it, so a gel band and a mass spectrometer never render as the same kind of number.
Not built Would you use this? Saying so is the only thing that moves it up the list.
Illustration with example data. Band sizing is in the app today.
Dose-response fits with their uncertainty
Fit four-parameter curves to plate data, with confidence intervals and the points that were left out, and why.
Gel photos
Every band sized against the ladder, and a call per lane. Measuring band amounts is in development.
Band sizingAmounts · in developmentFlow cytometry
Drop FCS files with the FlowJo workspace and Gelly reads your gates, then compares groups with one number per sample.
FCSFlowJo gatesMicroscopy
Count spots at the scale you pick and track them across frames of a time-lapse or Z-stack.
CountTrackWet lab and computation in one record
Attach the Jupyter notebook that analysed the run, let Claude Code or Codex add their results with their names on them, and keep it next to the protocol and the raw data it came from.
Jupyter notebooksClaude Code and CodexOne recordAsk questions of your own data
A discussion model reads the flow record, the gel result or the run log, not just your words, and cites what it used.
Reads records and plotsCited answersYou choose the model, and where your data goes.
Pick the model for each question. The strongest reasoning runs in the US; DeepSeek V4.1 Flash, hosted in Paris, keeps your data in the EU and reads up to about 1,000 pages per question. Gelly shows which model wrote every answer.
Strongest reasoning. Best for protocols, reviews and troubleshooting.
Our best option in the EU: your data stays there. Reads about 267 pages of sources per question, about 1,000 on Premium. Trained by DeepSeek (China).
The model runs on your computer; notebooks still sync as usual. Makes more mistakes; for drafts you check.
Plain-language confidence on every AI answer and analysis: what to trust, and what to check.